Most CPOs cannot answer the only question that matters. We think we can.
Stefan Furlan, CEO, Dodona
One of your sites went quiet in April. You found out in May.
Then the real work started. Zapmap, to see whether anyone had built nearby. A news search, in case there was a press release. Two competitor apps, to check their tariffs. A spreadsheet to hold it together. By the time you had an answer you believed, the quarter had closed and the site had been quiet for two months.
If you run a charging network, I suspect you have lived some version of that. I have watched charge point operators describe it, in almost identical terms, in nearly every conversation we have had this year.
The only question that matters
Three weeks of work, and at the end of it you still would not bet the quarter on the answer.
The question is just: why.
Everything follows from it. You cannot price against a competitor you have not noticed. You cannot fix a fault you have spent a month calling a demand problem. You cannot defend a site to a board, or to a lender, without knowing what actually moved.
And here is the thing that has been true for as long as this industry has existed.
When the reason sits inside your fence, you can answer it. Your systems are built for exactly that and they are good at it. Sessions, energy delivered, faults, revenue per charger, down to the connector.
When the reason sits outside your fence, you cannot. Not slowly, not approximately. You cannot.
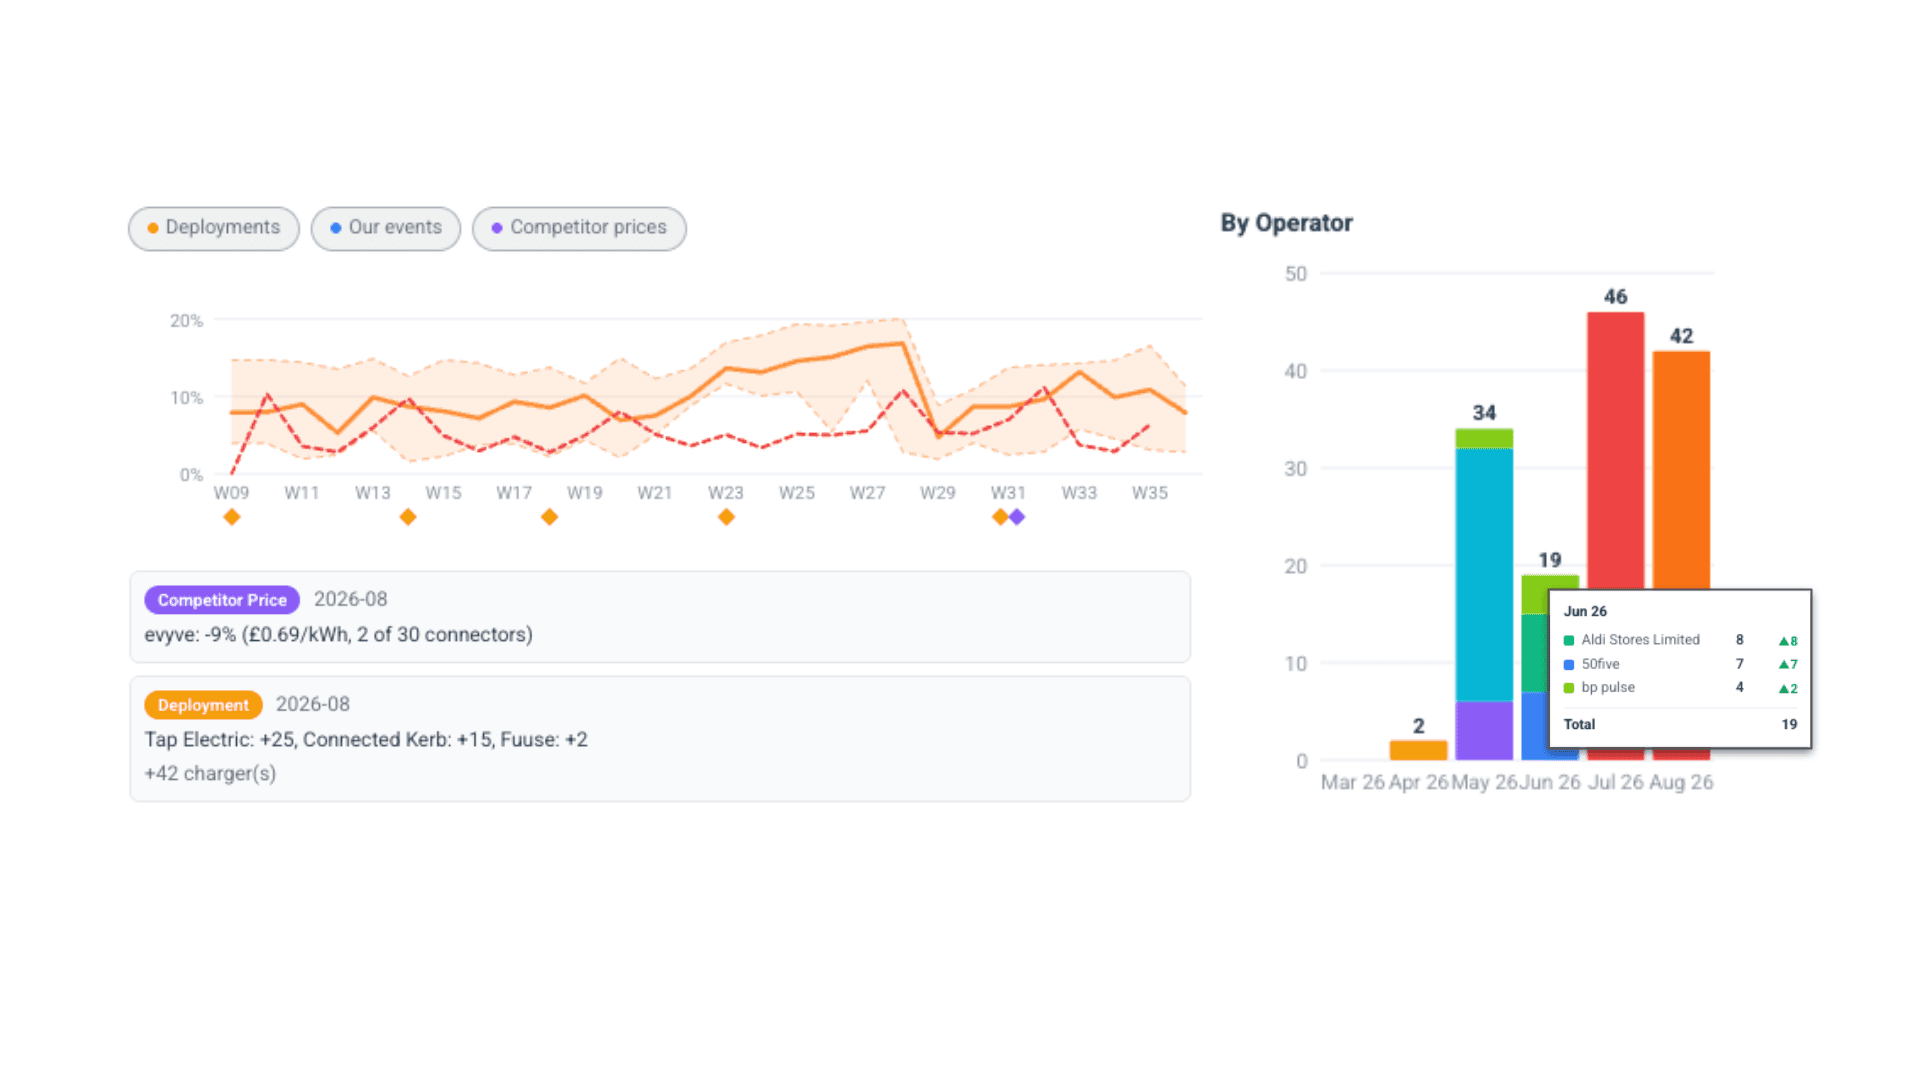
Twelve new bays opened four hundred metres away. A rival dropped its tariff by seventeen percent. The whole local area dipped because the retail park spent six weeks resurfacing its car park. Nothing in your data will tell you any of that, and all three will show up as your site underperforming.
There are five families of cause and your own data sees one of them clearly. We wrote up the full set in a separate diagnostic guide, so I will not repeat it here.
Why this matters more than it did
None of the above is new. What has changed is what the market pays for.
Strategy& found this year that utilisation and asset productivity now sit among the top priorities for almost sixty percent of European operators. The capital coming into the sector has changed shape too. The large financings announced by European operators since the start of 2025 have arrived overwhelmingly as debt and green loan facilities rather than equity, and debt underwrites performance in a way equity never had to.
At the same time, Zapmap and the Green Finance Institute put UK ultra-rapid utilisation at 12.8 percent in the fourth quarter of 2025, against 12.4 percent a year earlier, while ultra-rapid capacity grew forty percent over the same period. Zapmap reads that as resilience, and they have a fair case. I read it as a flat line on revenue per charger during a period of heavy investment.
Building is not finished and will not be for years. But the returns question has moved. For most CPOs it is no longer only where to build next. It is whether the assets already in the ground are doing what they were underwritten to do. Which takes you straight back to why.
Every piece of the answer exists. Nothing joins them.
Here is what I find odd about our industry. Almost every input needed to answer that question already exists somewhere.
Your CPMS holds your sessions. A monitoring tool holds your faults. A mapping service holds who is where. Somebody's press release holds the price change. A planning tool holds the traffic and the demographics.
None of them are joined. So the joining gets done by a person, manually, in a spreadsheet, after the fact, for the handful of sites somebody had time to look at. Which is exactly why it happens monthly rather than daily, and why it stops entirely in a busy week.
Where our data comes from
I will be short about this, because it is the part of the business we guard most closely.
Dodona has spent years building what we believe is the most complete and most accurate picture of the charging market that exists. Every public charger, who runs it, what it charges, how heavily it is used, and the traffic, demographics, vehicle parc, demand conditions around it and so much more. It is why operators come to us to decide where to build, and it is the reason our site assessments still hold up once the site is live.
Until this year, all of that pointed forwards. It answered one question. Where should we build next.
This year we pointed it backwards, at the assets already in the ground.
The same picture that tells you a site is worth building tells you, once it is live, why it is not performing. Same data, second question. As far as I can tell, nobody had asked it.
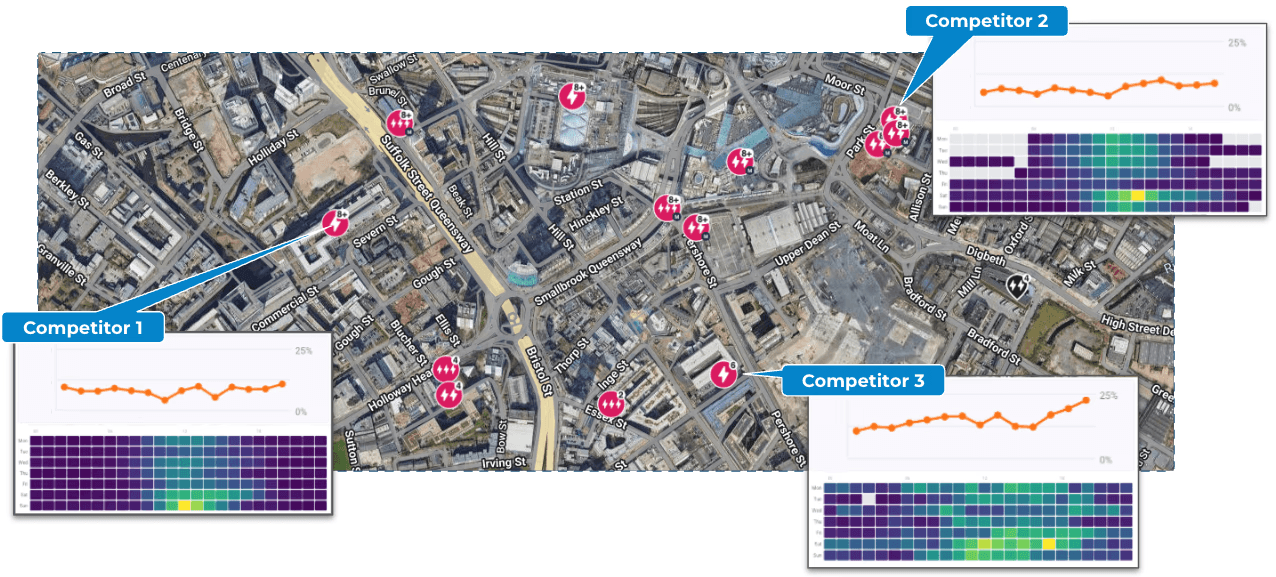
Charger by charger across one city catchment. Not a network average, and not our own estate.
What we built
Network Optimisation is the result. It is the operating layer for a network that is already live, and it sits above the systems you run rather than replacing any of them.
It watches your network and the market around it. It tells you when something moves, on either side. It ranks what it finds by the annualised revenue at stake rather than by a percentage, so the list arrives in the order a commercial owner would choose. Then it holds each action open until somebody can show it worked, against the number that was forecast when the action was created.
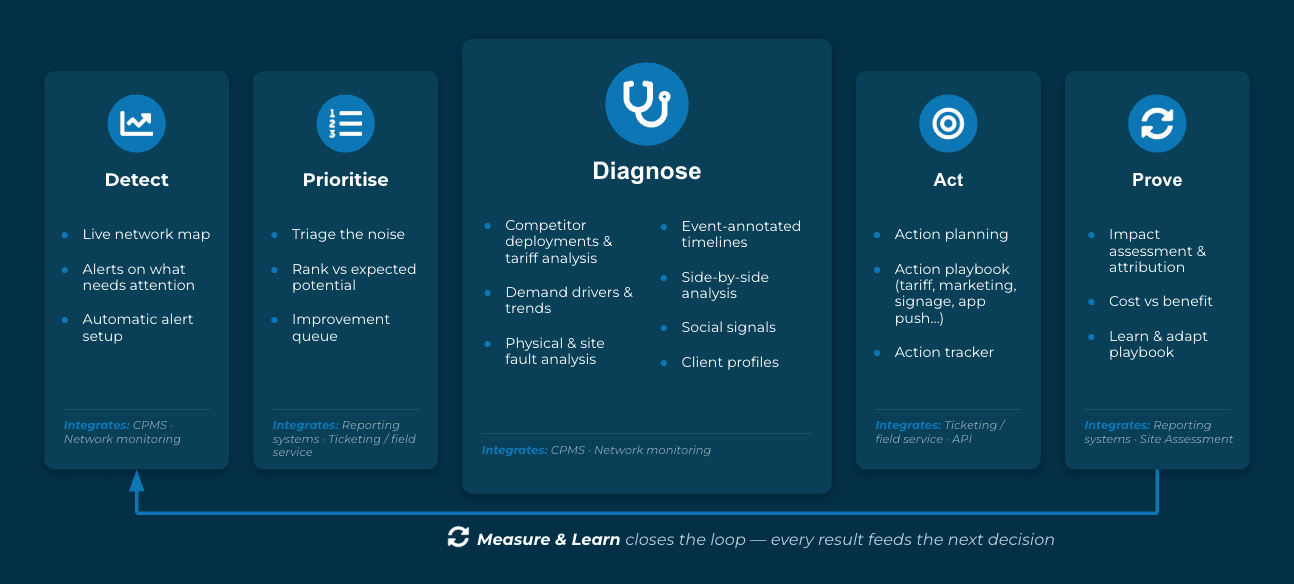
Detect, prioritise, diagnose, act, prove. The last step is the one that makes the next decision better.
That last part is the one I would defend hardest. Plenty of tools will tell you something is wrong. Very few will tell you whether the fix paid for itself, and without that the loop never closes and nothing compounds.
What to actually do once you know the cause is a separate question, and a practical one. We wrote up twenty three of the moves operators actually use, from tariff changes to signage to switching a site off for a period.
What surprised us
Every operator we showed this to already had dashboards. Good ones. In a couple of cases more granular than ours, built on their own session data and watched every day.
Not one of them had any view of what was happening outside their own estate.
That reframed what we were building. The gap was never reporting. CPOs report on themselves perfectly well. The gap is that the reporting stops at the fence, and the reason a site underperforms is usually on the other side of it.
If any of this sounds familiar
We are running Network Optimisation with a small group of design partners now, and opening it more widely after that.
If you run a charging network and the first paragraph sounded like your last quarter, I would like to talk to you.
You can put time straight in my calendar here.
Stefan

Leading charge point operators trust our intelligent platform to optimize and scale their EV charging business with data-driven insights and AI automation.
Follow us:
Get in Touch
128 City Road, London, EC1V 2NX
370 Jay St, 7th Floor, New York, 11201
Dunajska cesta 5, 1000, Ljubljana
© Dodona Analytics Ltd