The cost of a percentage point

We talk to many CPO purchasing teams, and most of them run the same exercise when choosing a platform. A detailed spreadsheet appears: feature-by-feature comparisons, weighted scores, price per site, contract terms. Serious work, done properly.
Almost all of them miss the variable that decides the outcome. Platform price is close to irrelevant. The question that matters is: how much more value does one platform create?
To show the absurdity of just how irrelevant price is, we ran an exercise on how much value a site assessment platform that scores sites in a way that produces just 1% better utilisation.
The answer runs into tens of millions of euros. Here is the maths.
The maths on one percentage point
Take illustrative AC and DC portfolios.
A plug runs 8,760 hours a year. At 7 kW delivered power, that is 61,320 kWh per plug at full use. One percentage point of that is 613 kWh per plug, per year. At €0.20 gross margin per kWh, one percentage point is worth €123 per plug, per year. Over a 20-year asset lifetime: €2,453 per plug.
Now scale it. A portfolio of 1,000 locations, with 4 plugs per site, has 4,000 plugs in total. One percentage point of utilisation accuracy across that portfolio is worth €9.8 million over the asset lifetime.
Run the same calculation on DC. A 50 kW plug at €0.40 margin per kWh delivers €1,752 per plug per year for each percentage point, or €35,040 over 20 years. A far smaller portfolio of 100 locations, with 4 plugs each, comes to €14 million.
And 1,000 sites for AC or 100 for DC are modest goals. Most CPOs aim significantly higher, so multiply by 5, 10 or 20 to get to your numbers.
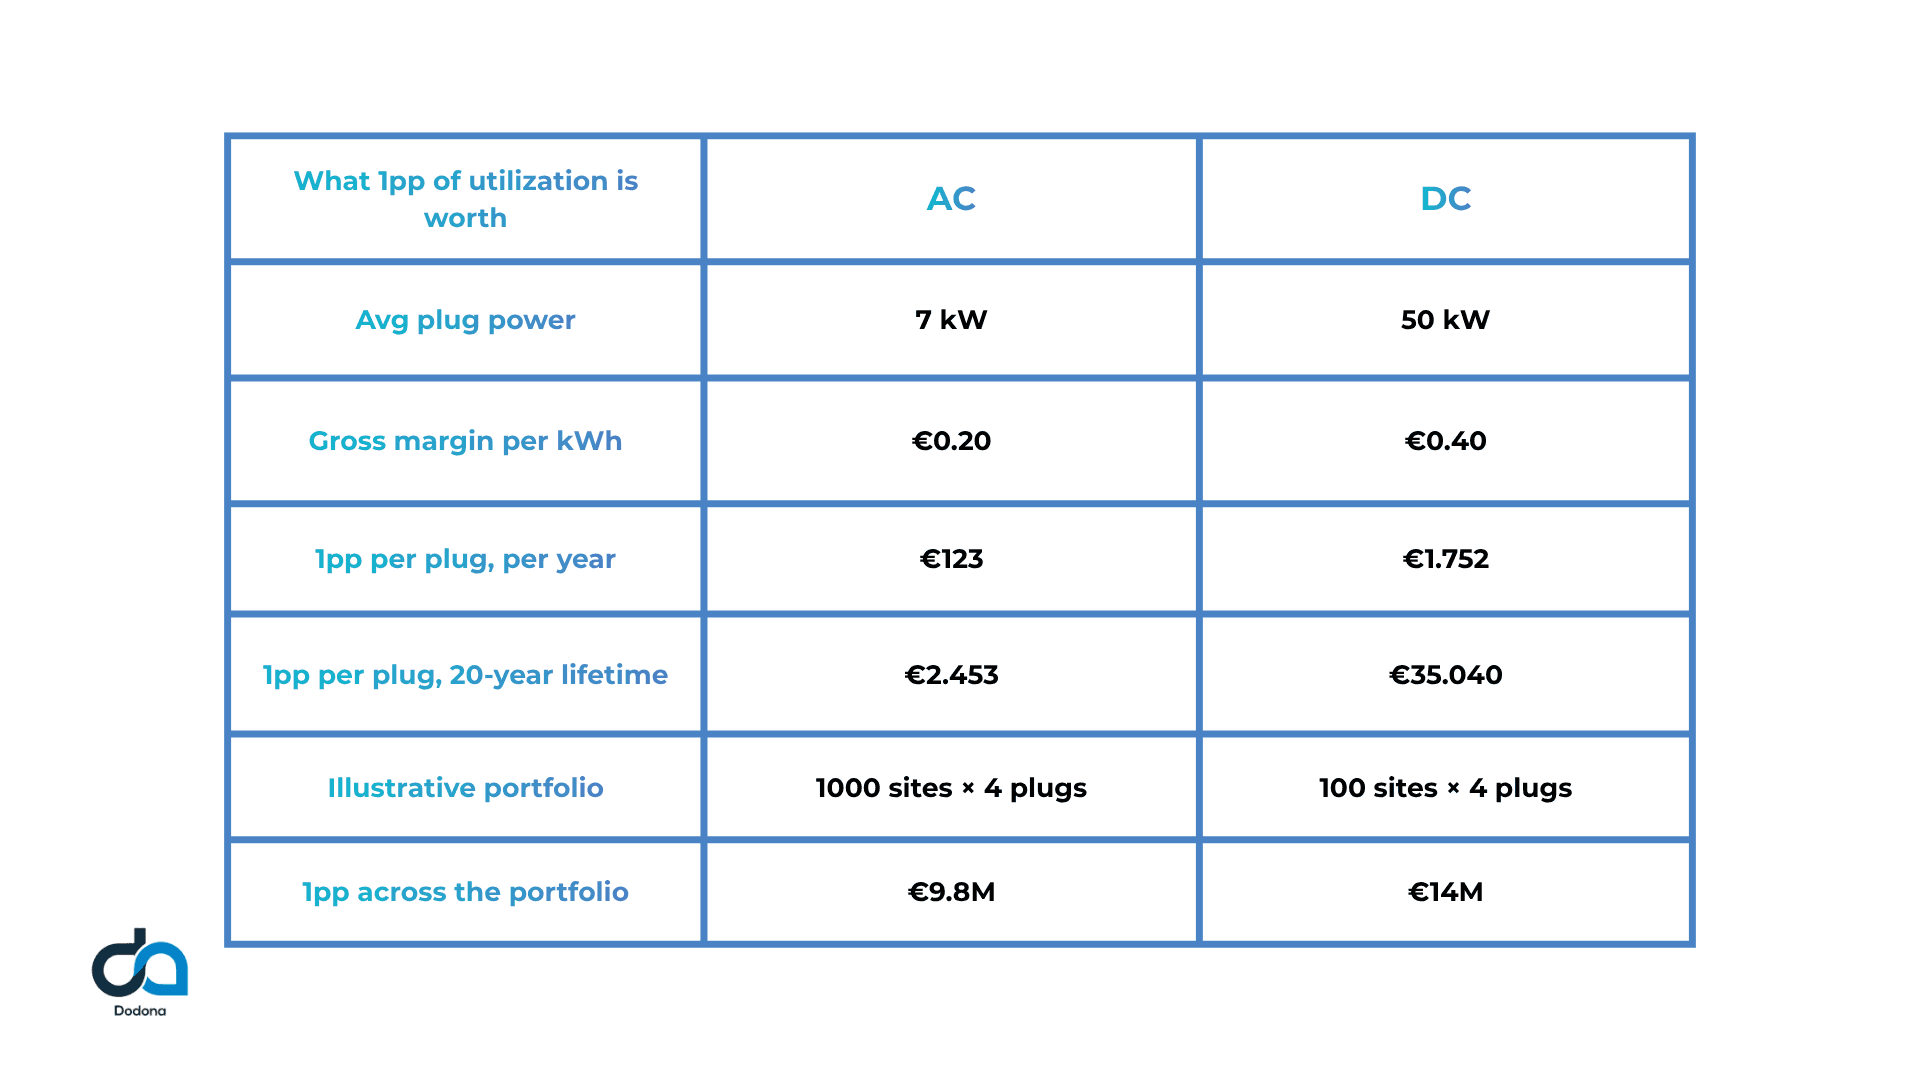
For DC, Fastned, the European fast-charging operator that publishes this number, reported a gross profit per kWh of €0.45 in 2023, rising to €0.58 in early 2026; we use €0.40 to stay on the safe side. For AC, we derived the number as follows: European public AC prices typically range from €0.30 to €0.50 per kWh, compared with commercial electricity costs of roughly €0.15 to €0.25 per kWh, resulting in a gross margin of €0.15 to €0.20 per kWh. We use €0.20, the level a well-run urban AC network reaches. If your numbers differ, substitute them. The shape of the conclusion survives.
The platform price is completely irrelevant
Dodona sits among the pricier solutions in this market. We are fine with that and, honestly, even a bit proud to be the higher-end option. The calculation above explains why the price tag barely matters.
Say the cheaper option saves you a few €10,000s a year but yields results that are 1 percentage point worse. That decision creates a short-term win and costs you in the ballpark of €10 million, even on the modest portfolio above.
That is the entire argument. The shrewd purchase teams we meet reach this conclusion on their own: what a platform costs carries no weight next to how well it lets you assess sites. The gap between a generic benchmark and a model built around a specific portfolio is where the money sits, and we are happy to explain how our site assessment models achieve far better performance there.
So, when you compare solutions, set the price column aside for a moment and ask one question instead: how accurately does each platform let you assess your sites? The answer is worth at least a hundred times the difference between the quotes.
See it on your own numbers
This whole calculation takes twenty minutes with your portfolio inputs. Book a demo. More on how we model utilisation at thedodona.com.

Leading charge point operators trust our intelligent platform to optimize and scale their EV charging business with data-driven insights and AI automation.
Follow us:
Get in Touch
128 City Road, London, EC1V 2NX
370 Jay St, 7th Floor, New York, 11201
Dunajska cesta 5, 1000, Ljubljana
© Dodona Analytics Ltd